---
title: "Finding campaign analytics"
slug: "introduction-to-performance"
description: "See analytics for all your banner campaigns on the Performance dashboard, or open one campaign to see charts of its deliveries, impressions, and clicks."
updated: 2025-05-08T15:21:17.000Z
canonical: "https://help.opensense.com/docs/introduction-to-performance"
---
> ## Documentation Index
> Fetch the complete documentation index at: https://help.opensense.com/llms.txt
> Use this file to discover all available pages before exploring further.
# Finding campaign analytics
## Overview
Opensense tracks analytics for your banner campaigns. You can see them in two places: the **Performance** dashboard shows all your campaigns, and each campaign's edit page shows charts for that campaign.
## Viewing analytics for all campaigns
In the navigation pane, select **Marketing** > **Performance**. The Performance dashboard opens.
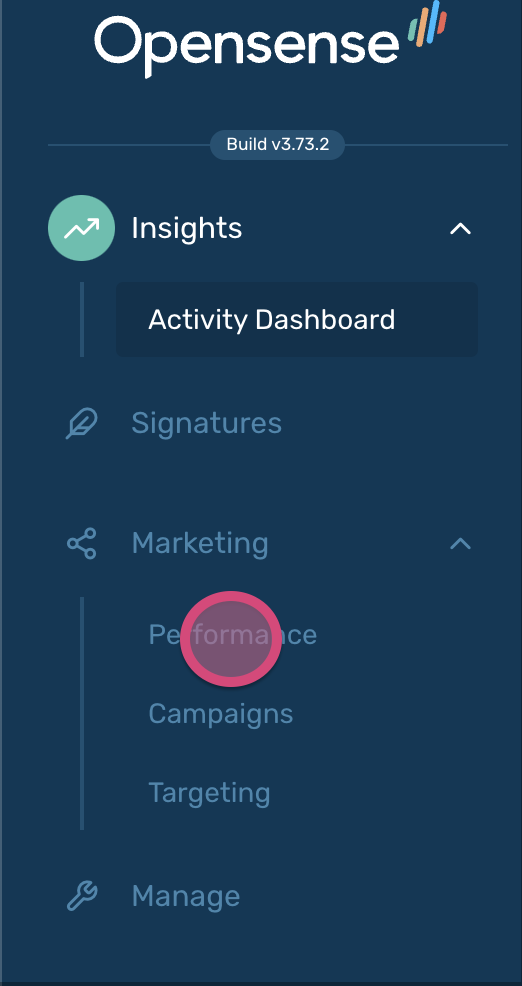 To compare campaigns, tags, and categories on the dashboard, see [Using the Performance dashboard](https://help.opensense.com/docs/performance-dashboard).
## Viewing analytics for one campaign
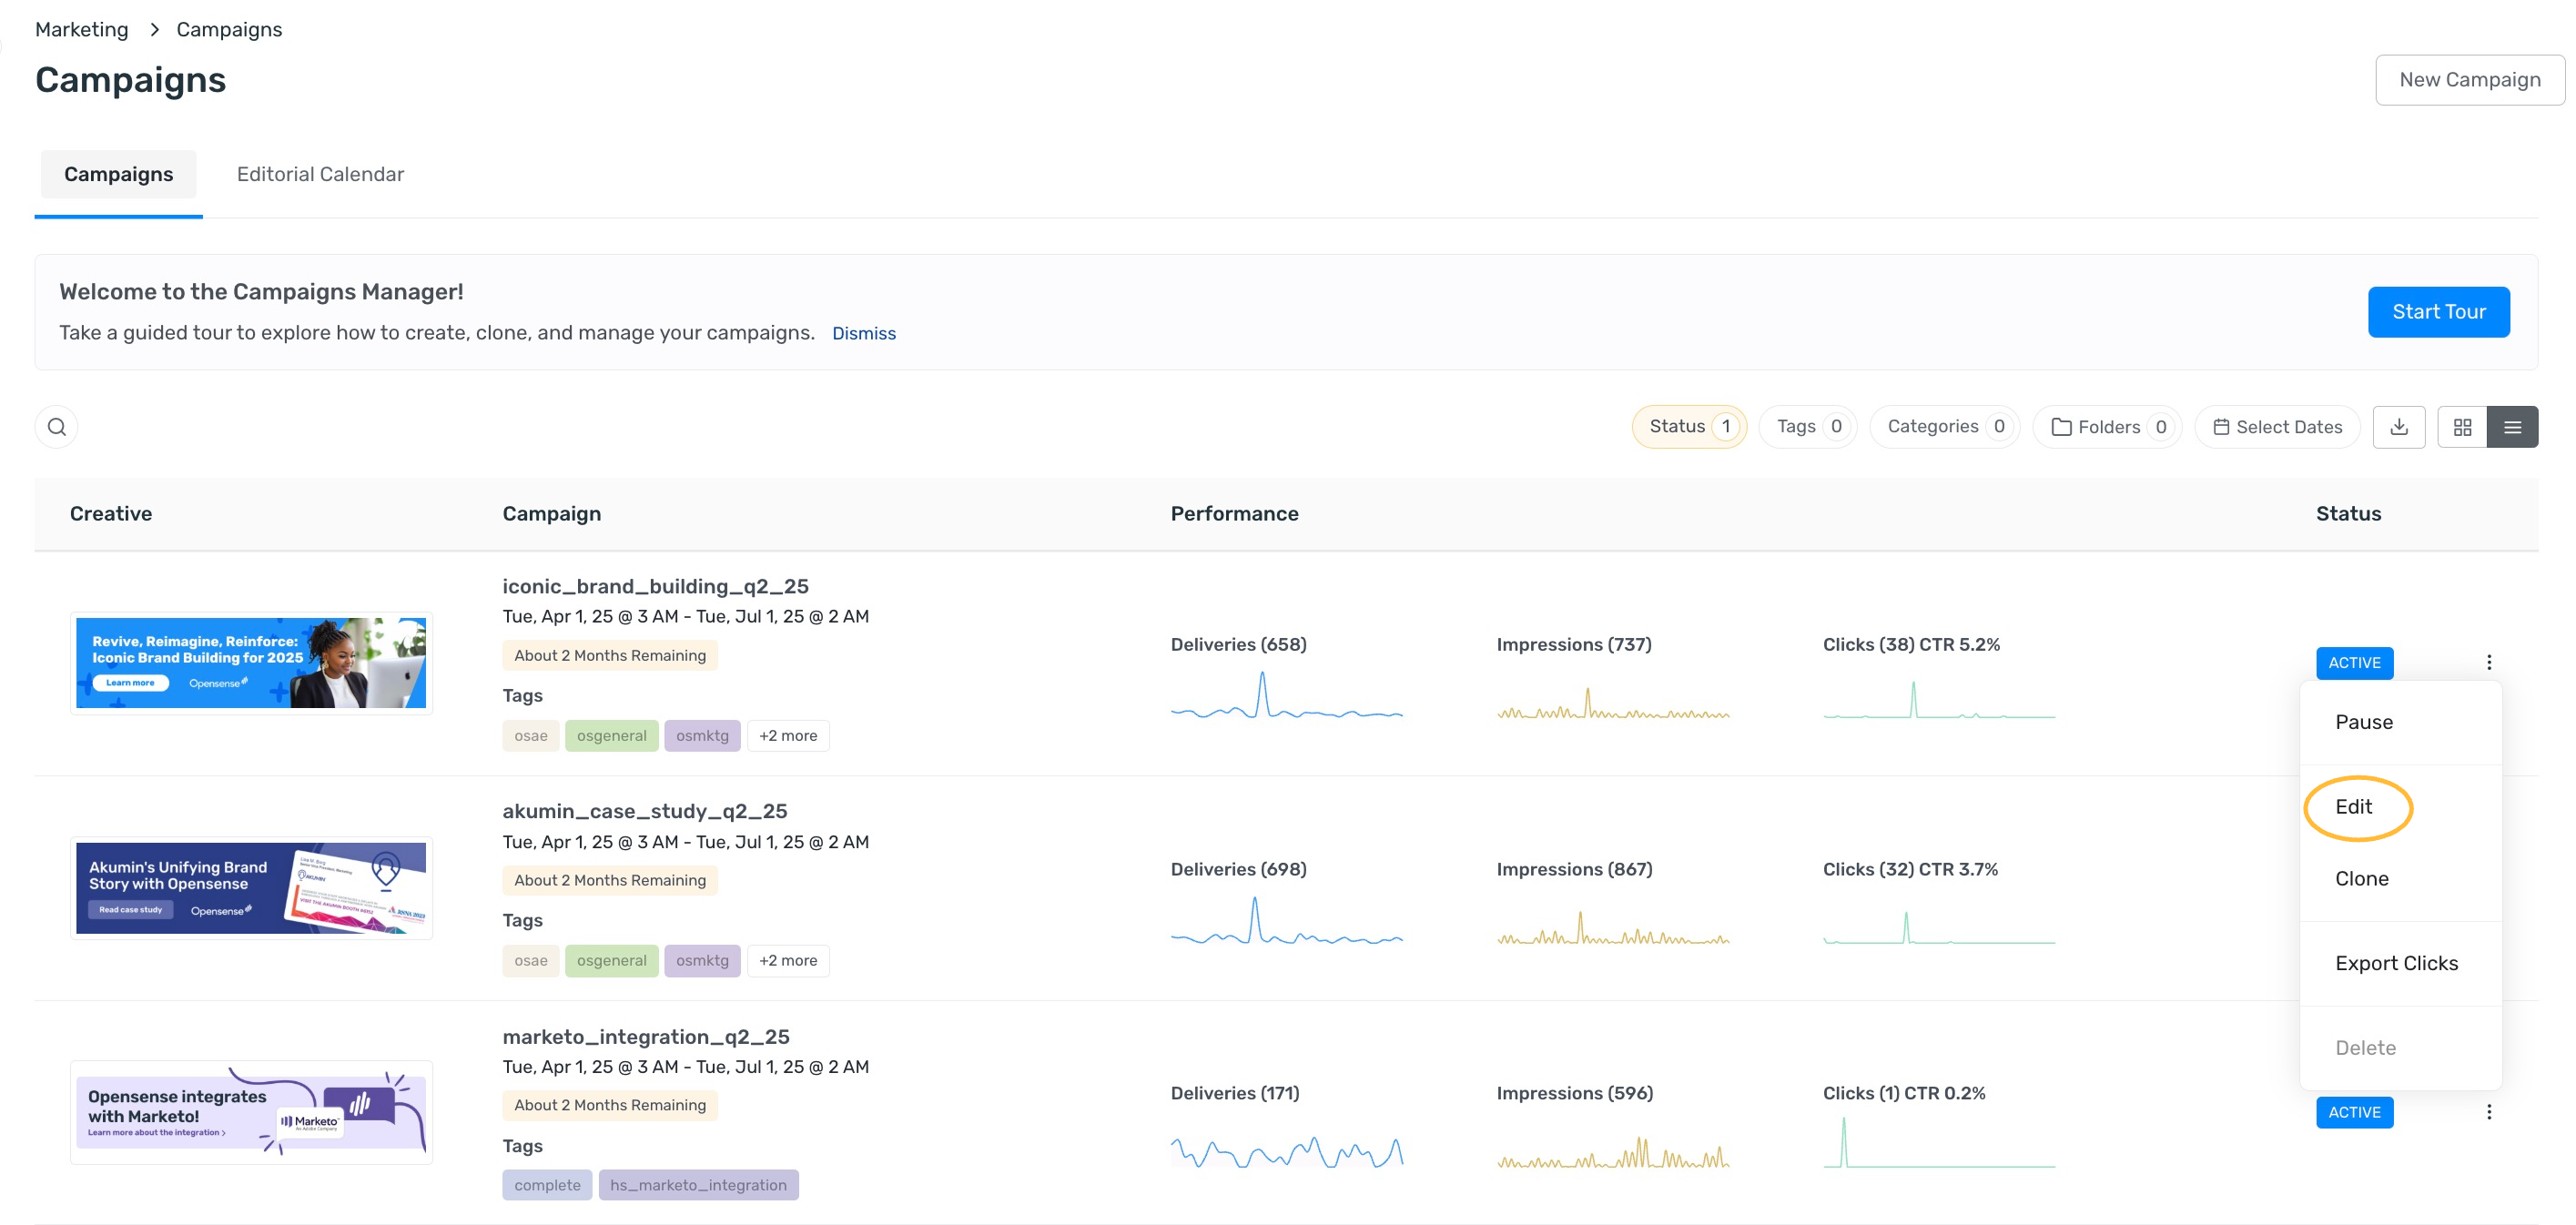
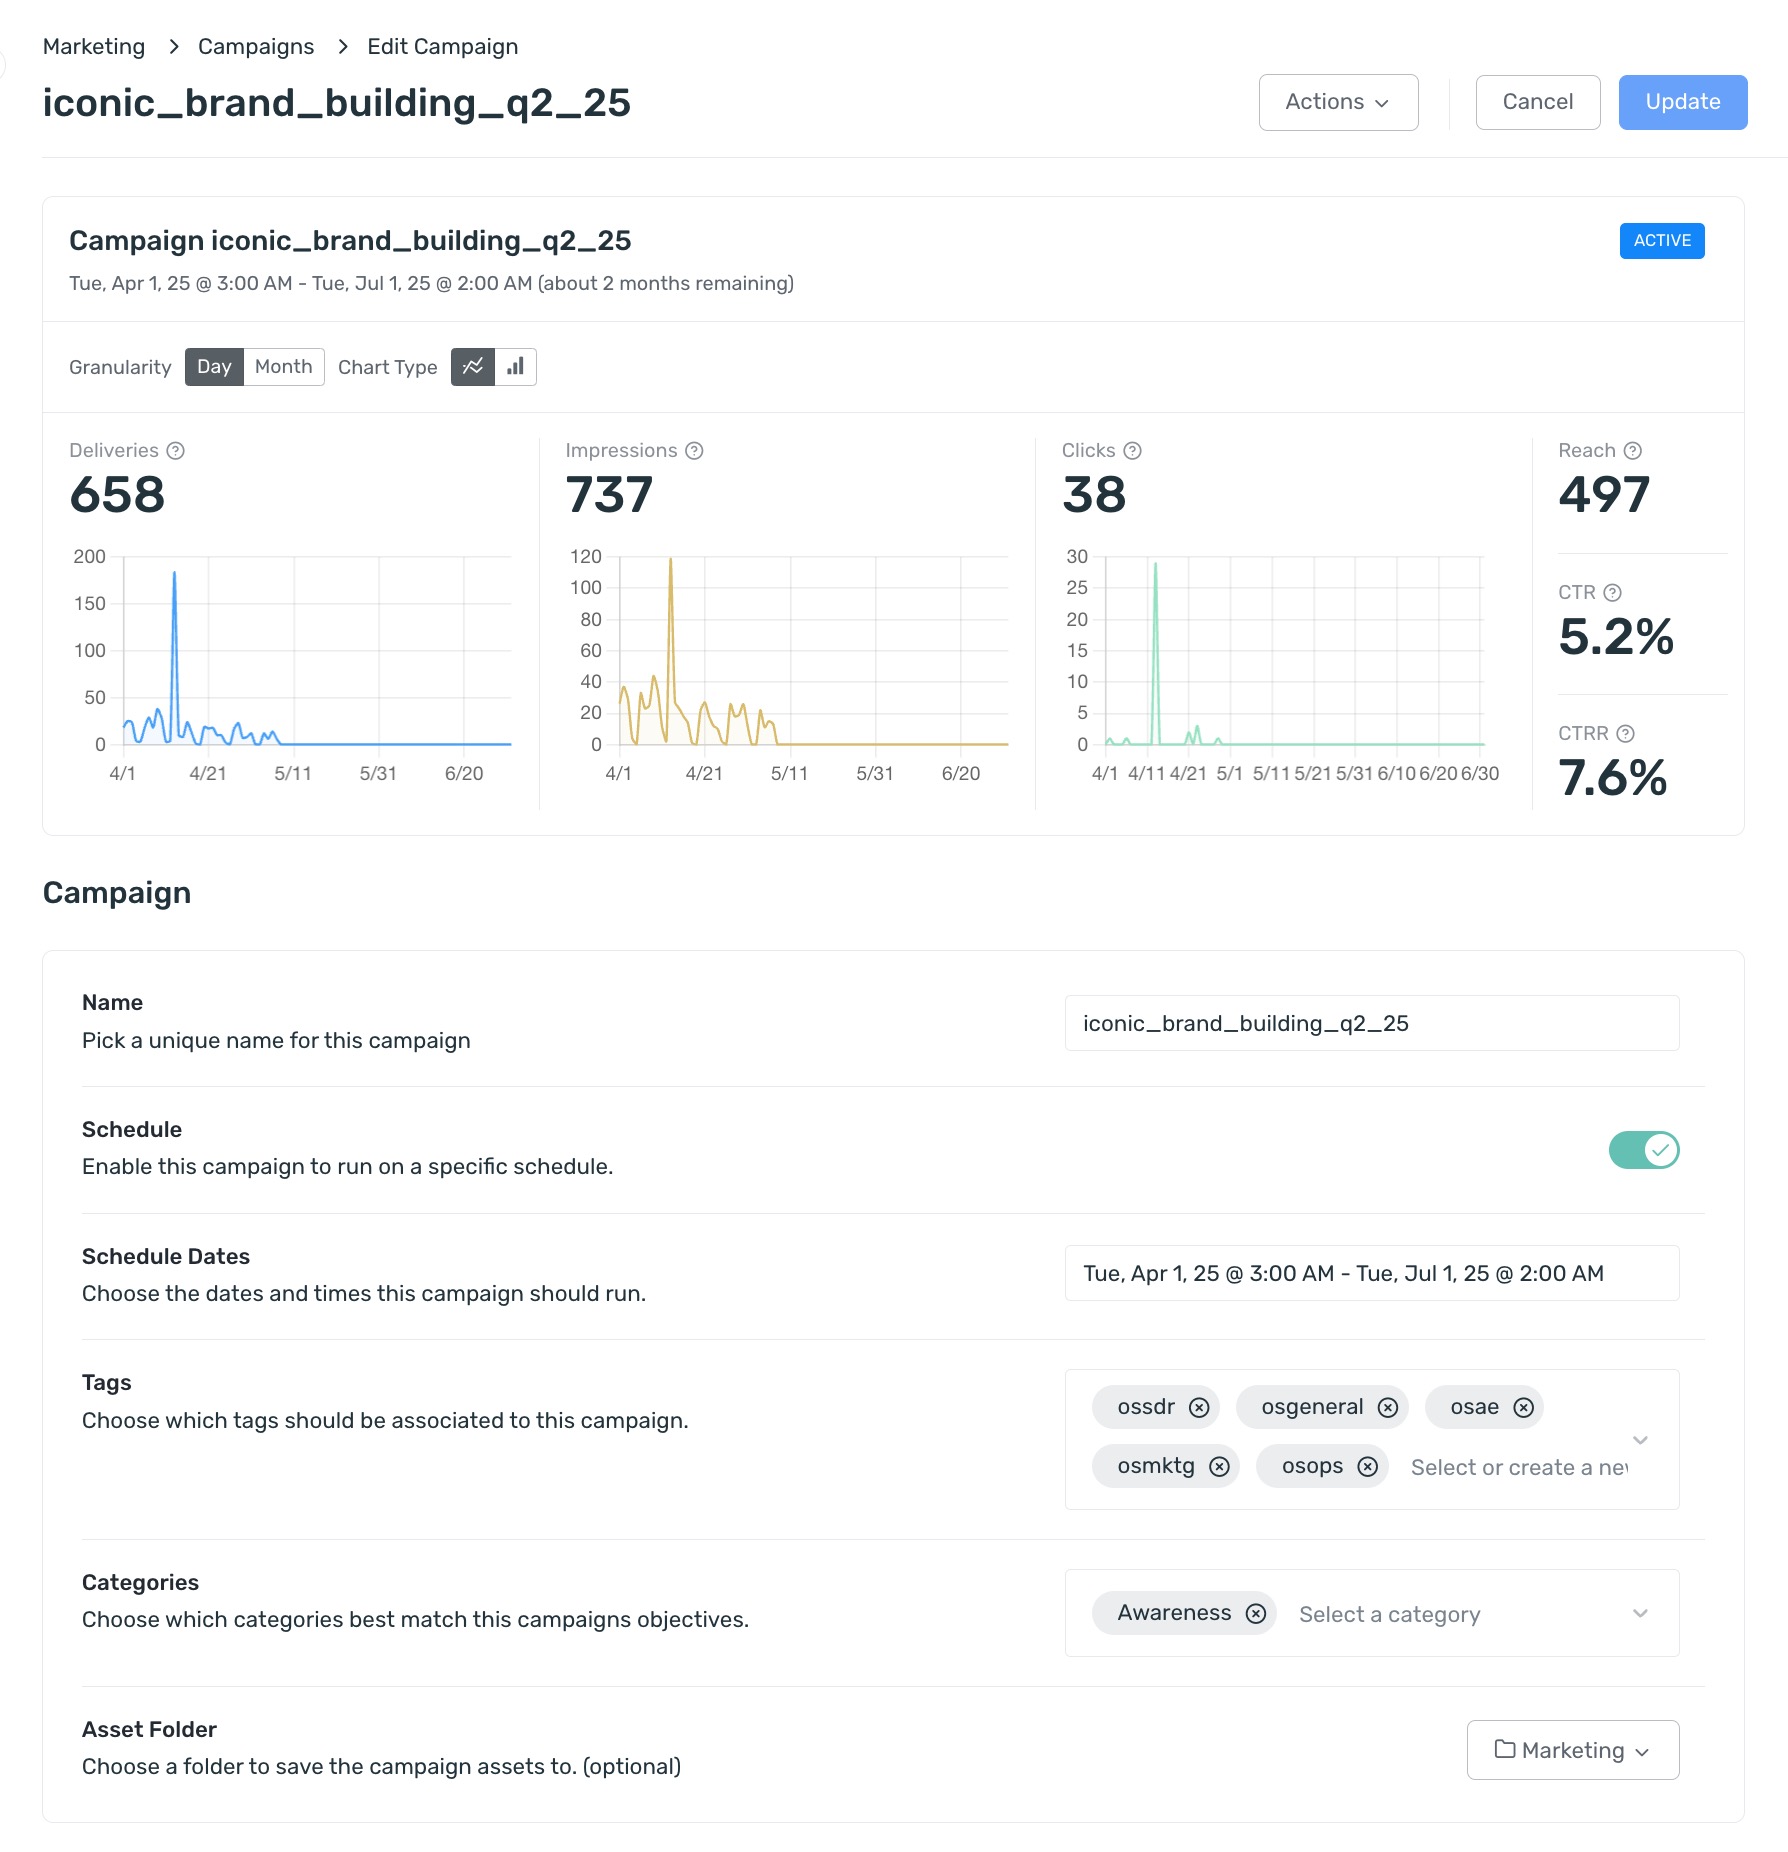
The **Campaigns** list shows the deliveries, impressions, clicks, and click-through rate (CTR) of each campaign. For charts and more metrics, open the campaign:
1. In the navigation pane, select **Marketing** > **Campaigns**.
2. On the campaign's row, click the actions menu (**⋮**) and select **Edit**. You can also click the banner image.
The edit page opens with the campaign's analytics at the top: **Deliveries**, **Impressions**, **Clicks**, **Reach**, **CTR**, and **CTRR**. Use **Granularity** to show the charts by day or by month, and **Chart Type** to switch between line and bar charts.
## What's next
- [Using the Performance dashboard](https://help.opensense.com/docs/performance-dashboard): what each metric means, and how to compare campaigns, tags, and categories.
- [Naming and organizing banners](https://help.opensense.com/docs/banner-management): name your campaigns and banners so that your analytics stay easy to compare.
- [Marketing overview](https://help.opensense.com/docs/marketing-table-of-contents): all the Marketing guides.