

Finding campaign analytics
Overview
Section titled “Overview”Opensense tracks analytics for your banner campaigns. You can see them in two places: the Performance dashboard shows all your campaigns, and each campaign’s edit page shows charts for that campaign.
Viewing analytics for all campaigns
Section titled “Viewing analytics for all campaigns”In the navigation pane, select Marketing > Performance. The Performance dashboard opens.
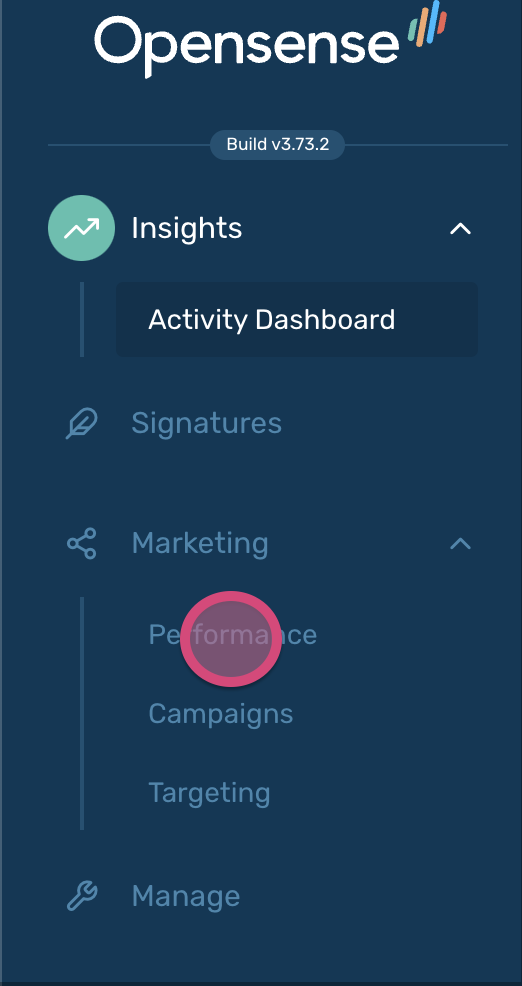
To compare campaigns, tags, and categories on the dashboard, see Using the Performance dashboard.
Viewing analytics for one campaign
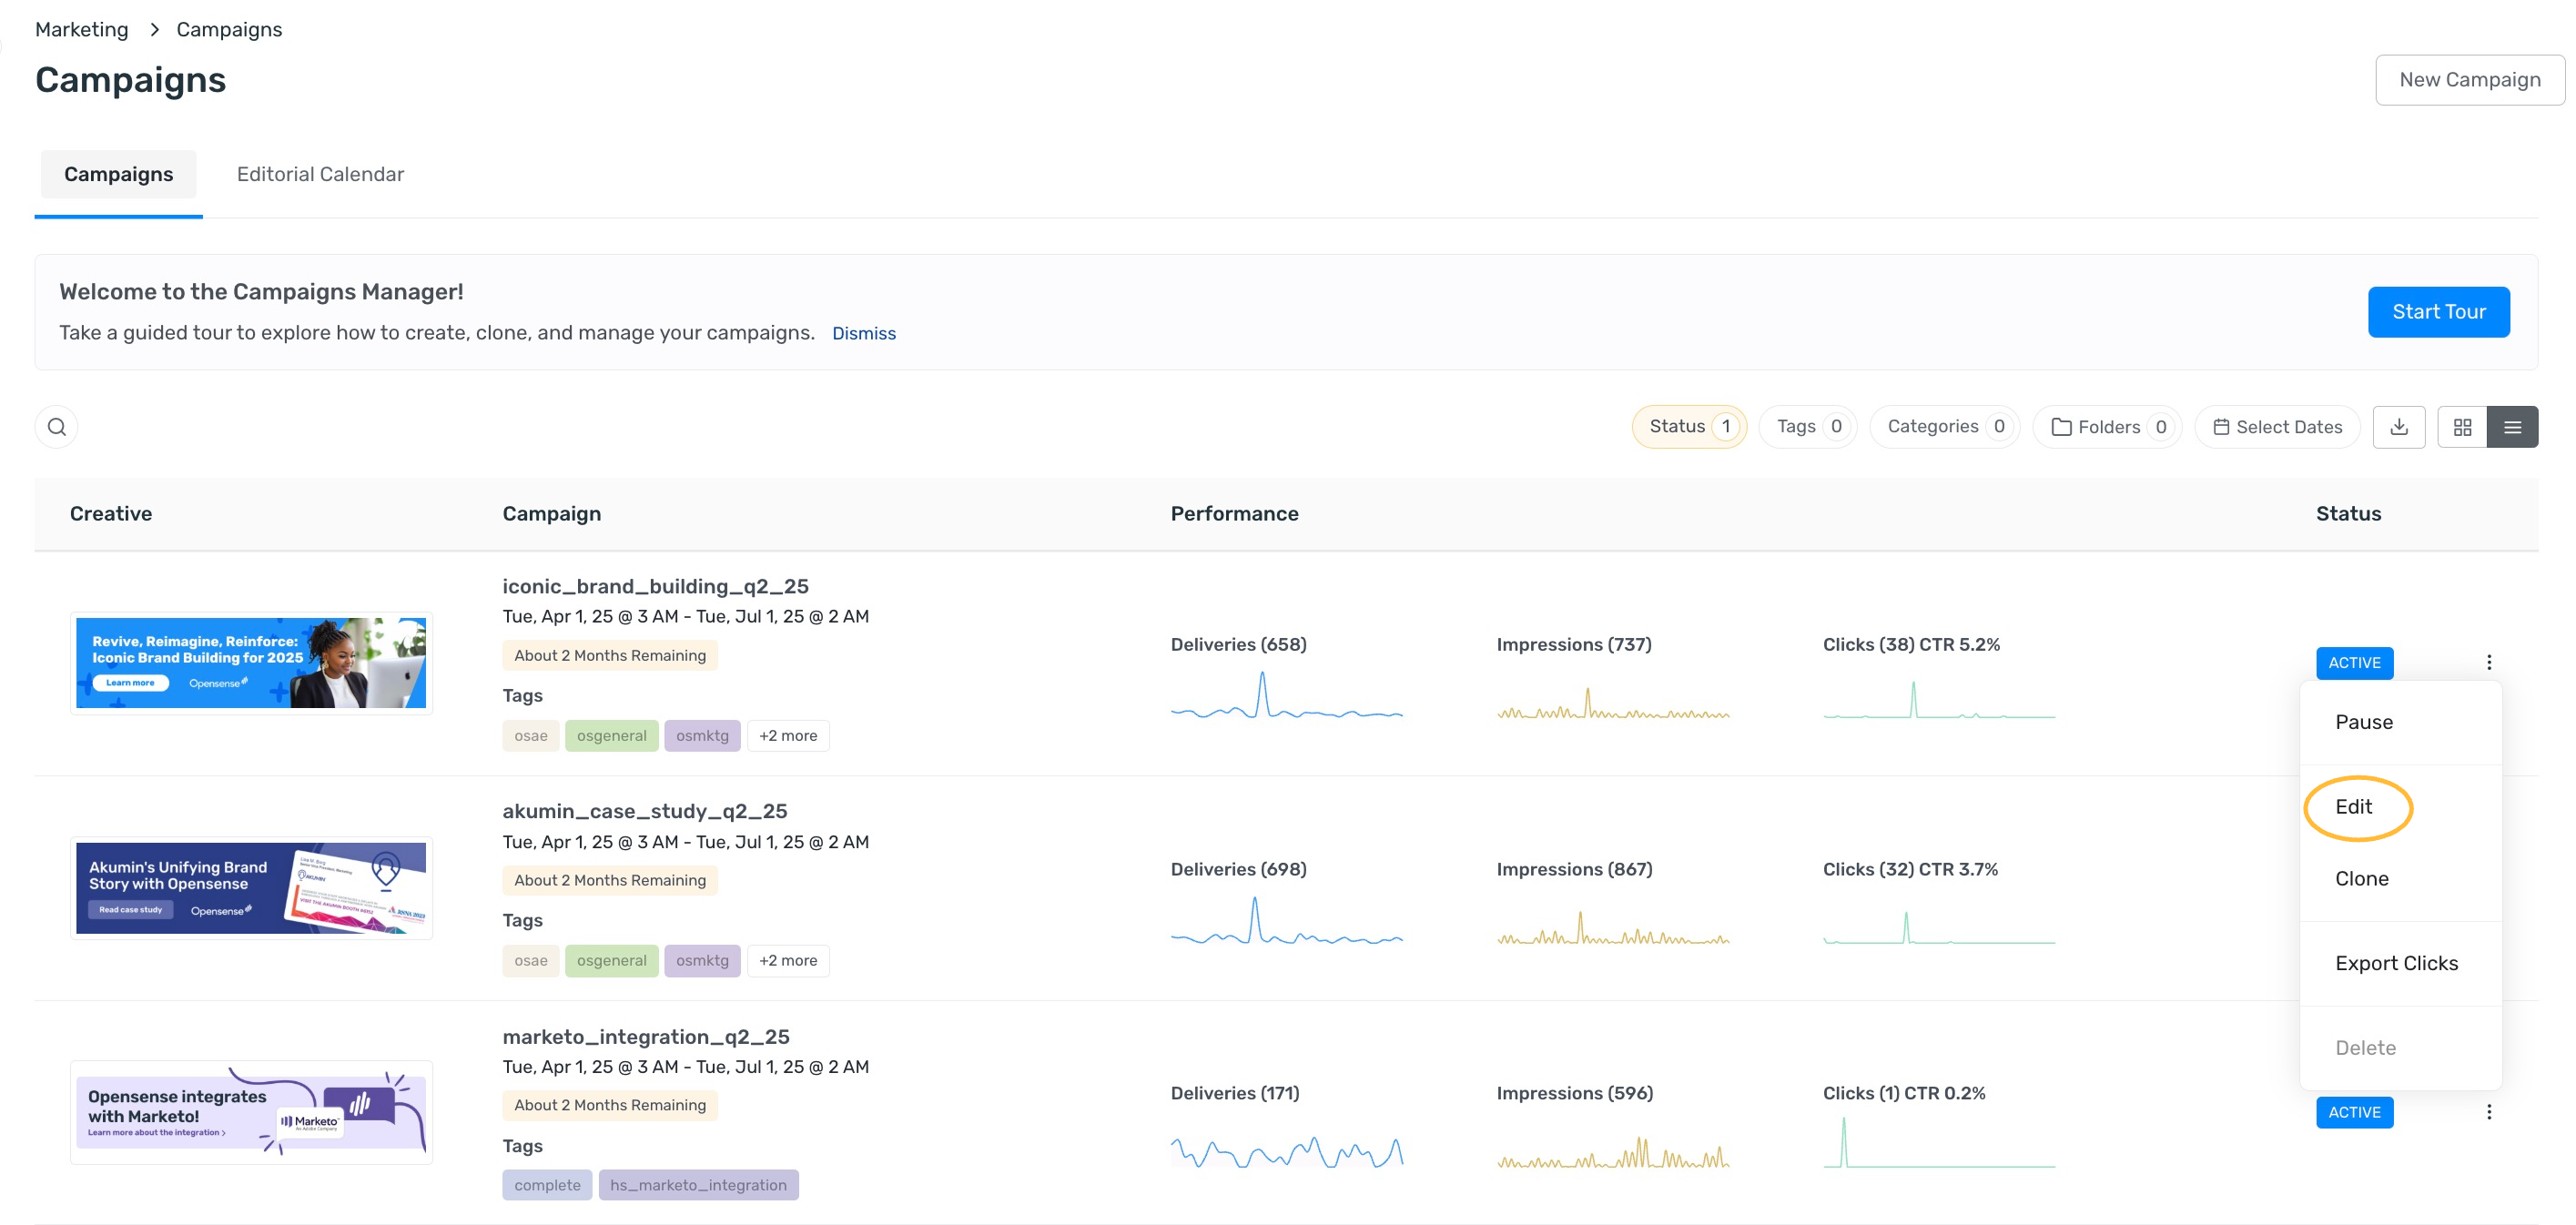
Section titled “Viewing analytics for one campaign”The Campaigns list shows the deliveries, impressions, clicks, and click-through rate (CTR) of each campaign. For charts and more metrics, open the campaign:
- In the navigation pane, select Marketing > Campaigns.
- On the campaign’s row, click the actions menu (⋮) and select Edit. You can also click the banner image.
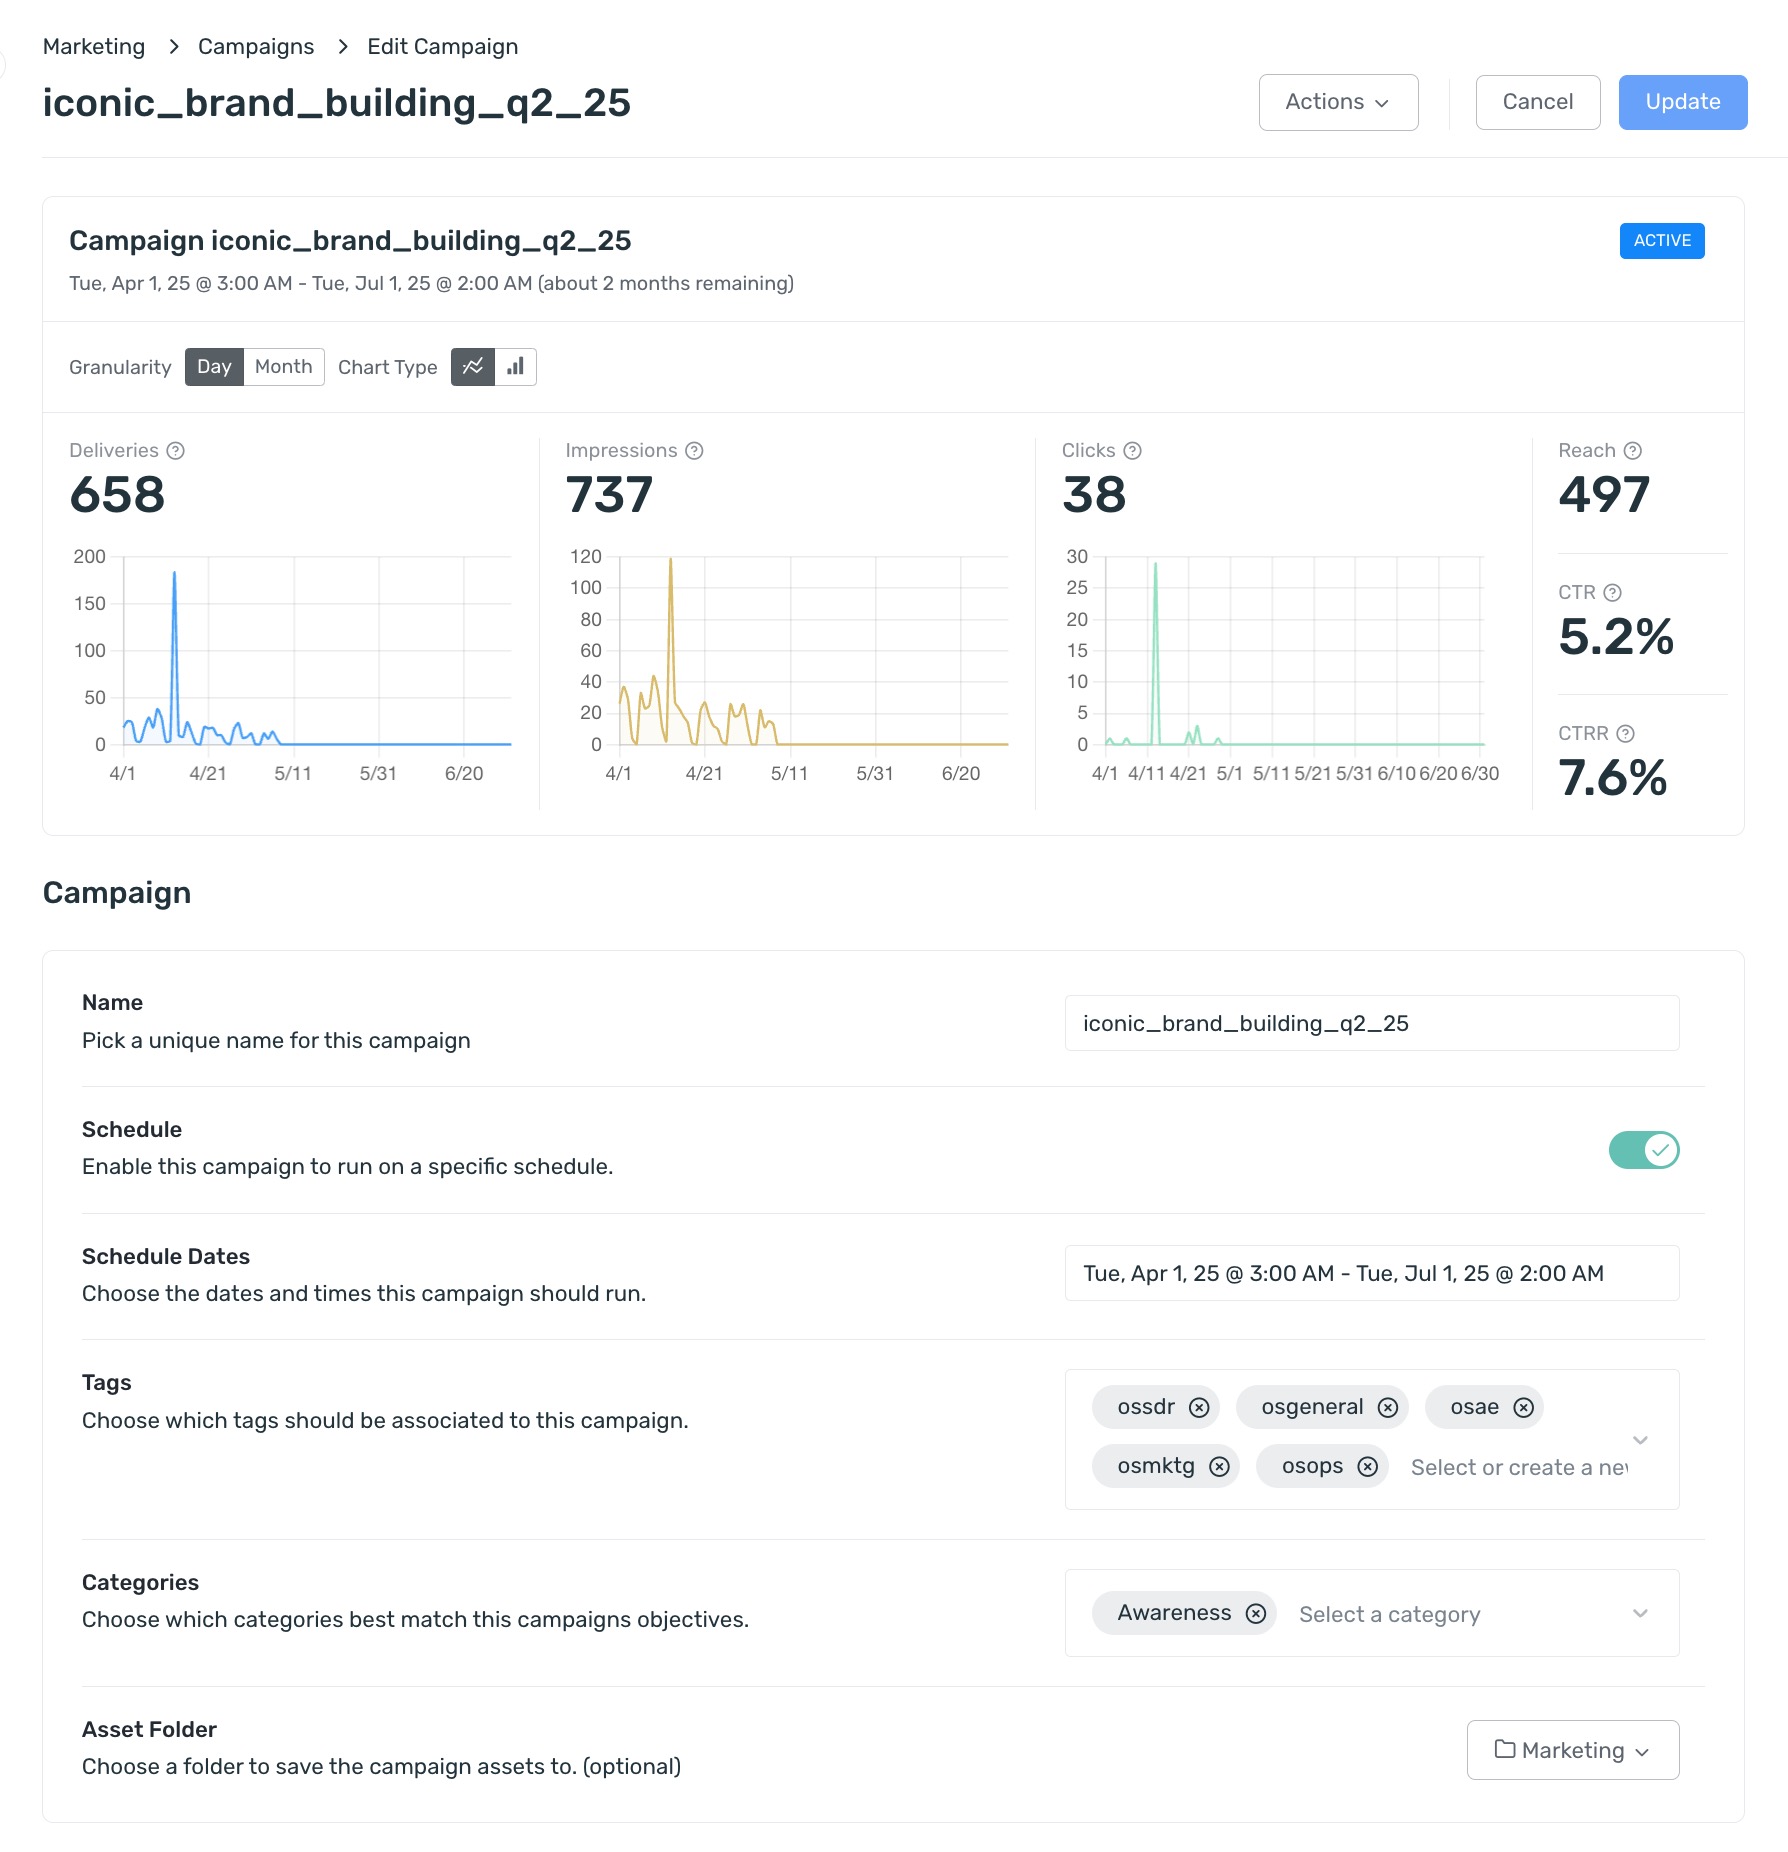
The edit page opens with the campaign’s analytics at the top: Deliveries, Impressions, Clicks, Reach, CTR, and CTRR. Use Granularity to show the charts by day or by month, and Chart Type to switch between line and bar charts.
What’s next
Section titled “What’s next”- Using the Performance dashboard: what each metric means, and how to compare campaigns, tags, and categories.
- Naming and organizing banners: name your campaigns and banners so that your analytics stay easy to compare.
- Marketing overview: all the Marketing guides.